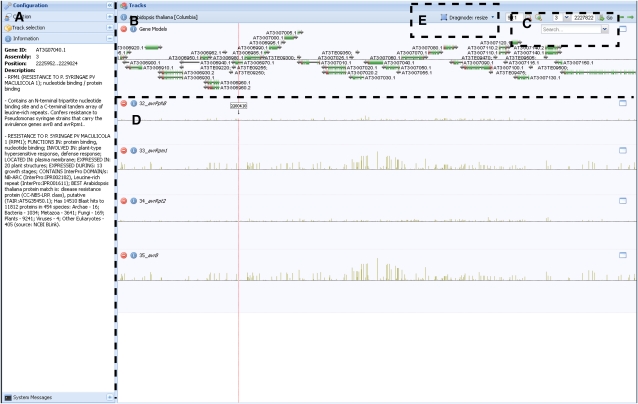
Figure 1.
A screen shot of the genome browser. Matapax allows users to view association P values in the context of the genome with the aid of the AnnoJ genome browser. This browser supports several features. A, The visible tracks can be selected in the side menu, and any information about the track source or gene annotation is also displayed here. B, The default TAIR genome annotation is the default track. The TAIR version is dependent on the marker database selected for association. Selecting the gene model names will display the model annotation in the side menu. C, The annotation track can be searched using the search tool. Searches can be made on both AGI codes and model annotation terms. D, The remaining tracks display the marker association strengths of each analyzed trait. Each analyzed trait is displayed in a separate track. The association P values are –log10 transformed, meaning the higher the bar, the stronger the trait-marker association. E, The genome browser enables browsing by “dragging” the tracks horizontally, scaling the values of the individual tracks as well as resizing the track height and zooming on areas of interest. Users can also go directly to positions of interest. The displayed figure shows high association between the avrRpm resistance phenotype and the rpm1 resistance gene, which has been shown to play a significant role in Pseudomonas syringae resistance (Grant et al., 1995). [See online article for color version of this figure.]

