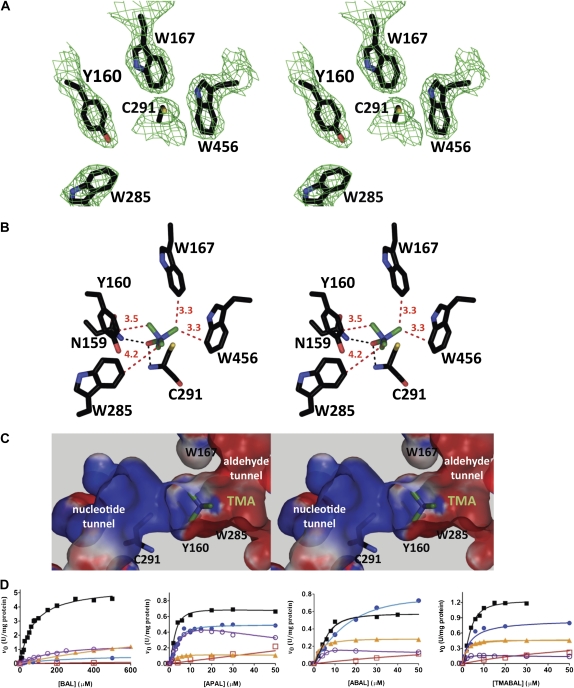
Figure 2.
Aromatic residues involved in binding of BAL to SoBADH. A, Stereoview of the 2Fo − Fc map contoured at 1 σ showing the aromatic residues in the aldehyde-binding site. B and C, Stereoviews of energy-minimized models of a BAL molecule docked into the active site showing the most favorable position of the trimethylammonium group when the carbonyl oxygen is kept inside the oxyanion hole and the carbonyl carbon is trigonal. In C, a section of the SoBADH active site shows the surface electrostatic potentials (−10 kT/e, red; 10 kT/e, blue) of the solvent-accessible molecular surface of the aldehyde and nucleotide entrance tunnels. Aromatic side chains are shown as sticks, with carbon atoms in black, oxygen in red, nitrogen in blue, and sulfur in yellow. The methyl groups are shown as green sticks. Distances of the methyl groups to the aromatic residues are given in angstroms and are depicted as red dashed lines. The hydrogen bonds between the carbonyl oxygen of the aldehyde and the oxyanion groups (i.e. the side chain amide nitrogen of Asn-159 and the main chain amide nitrogen of Cys-295) are depicted as black dashed lines. These panels were generated using PyMOL (DeLano, 2002). D, Saturation curves of wild-type SoBADH (black squares) and the mutants Y160A (red squares), W167A (blue circles), W285A (orange triangles), and W456A (violet circles) with BAL, APAL, ABAL, and TMABAL as substrates. Assays were carried out at pH 8.0 and fixed 0.2 mm NAD+. The points shown are experimentally determined values, and the lines drawn through these points are those calculated from the best fit of the data by nonlinear regression to Equation 1. Other experimental details are described in “Materials and Methods.”

