Figure 1.
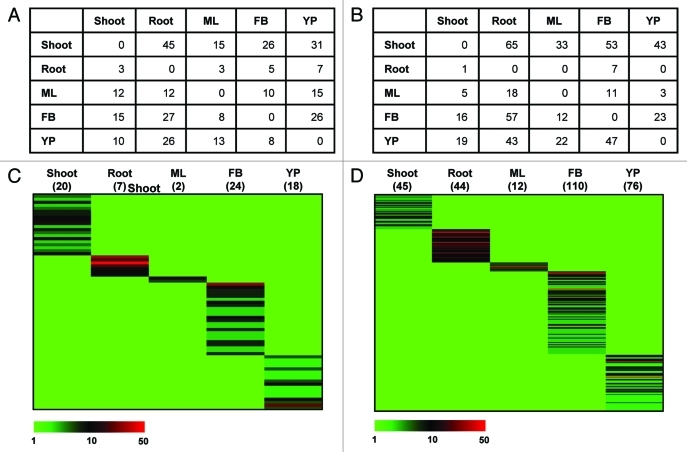
Differential and tissue-specific expression analysis of legume- and chickpea-specific transcripts. (a,b) Number of legume- (A) and chickpea- (B) specific transcripts preferentially expressed in each tissue sample as compared with others in tissue-by-tissue comparison. The transcripts represented by ≥ 2-fold rpm as compared with other tissue sample are given. For the transcripts in each cell, there is preferential expression in the column tissue than the row tissue sample. (c,d) Heatmap of the legume- (C) and chickpea- (D) specific transcripts specifically expressed in various tissue samples. The number of transcripts showing specific expression in different tissue samples is also indicated. The color scale represents rpm value. The chickpea-specific transcripts with > 50 rpm (very highly expressed) are not distinguished by color scale (they are represented by the same color as that of transcripts with 50 rpm) to differentiate the genes with low to high expression. ML, mature leaf; FB, flower bud; YP, young pod.

