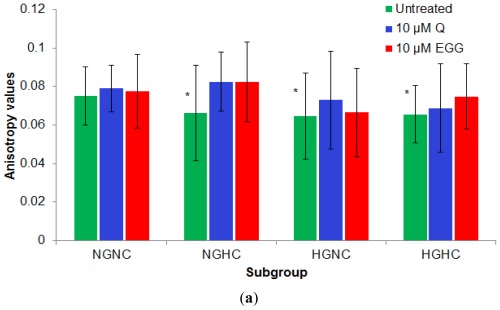
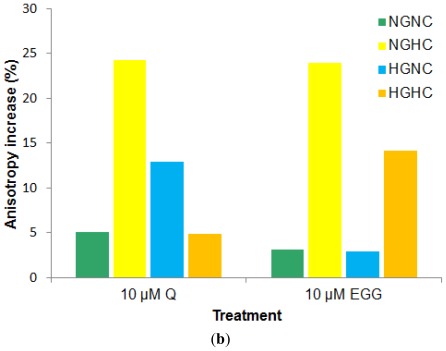
Figure 6.
Q and EGCG effect on the PBMCs membrane anisotropy values in subgroups (a) absolute anisotropy value for each subgroup; (b) % membrane anisotropy increase (calculated according to Equation 2) under the effect of Q and EGCG (* p < 0.01, compared to NGNC subgroup).


