Figure 4.
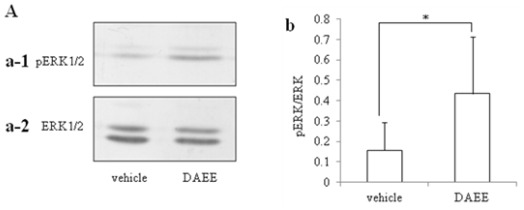
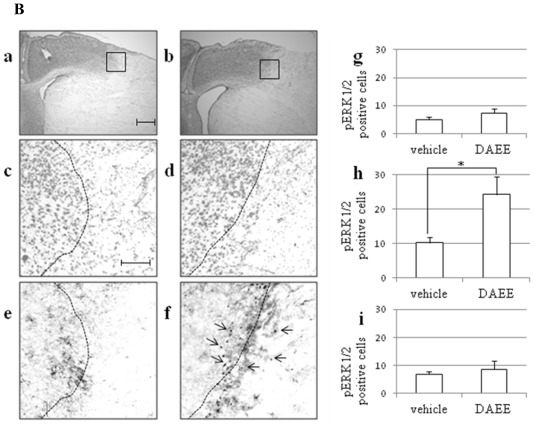
Level and distribution of pERK1/2 in the infracted brain after vehicle- or DAEE-treatment. (A) Immunoblot profiles of pERK1/2 (a-1) and ERK1/2 (a-2) of the vehicle- and DAEE-treated infarct brain 96 h after PMCAO. b: Quantitative analysis of the ratio of the intensity of the band of pERK1/2 to that of ERK1/2. The values are expressed as the means ± SEs (n = 6). Significance: * P < 0.05 vs. vehicle (Student’s t-test). (B) Photographs “a” to “d” showed Nissl stained profiles, and “e” and “f” are immunostained ones by anti-pERK1/2. Photographs “a” and “b” are Nissl stained profiles taken with low-power-magnification. The boxes in photograph “a” and “b” include the border region between infarct and non-infarct areas, and enlarged as shown in photographs “c” and “d”. Photographs “a” and “c” are profiles obtained from the vehicle-treated group and “b” and “d”, from the DAEE-treated group. The scale bar for both photographs is 500 μm. The dotted lines in photographs “c” and “d” indicate the borderlines between the infarction and non-infarction areas that were determined in terms of the Nissl-positive cell density. Photographs “e” and “f” are profiles taken from the adjacent sections immunostained for pERK1/2 in the vehicle- and DAEE-treated groups, respectively. The same dotted lines shown in “c” and “d” were drawn on the photographs “e” and “f”. The scale bar indicated in “c” is 100 μm and also applicable to “d”–“f”. The pERK1/2-positive cells were counted in the 3 regions, i.e., the infarction area lateral to the borderline (photograph “g”), the ischemic penumbra on the borderline (photograph “h”), and the normal area medial to the borderline (photograph “i”). Each count was expressed as the number of pERK1/2-positive cells/(200 × 200) μm2. These cells, indicated by the arrows in photograph “f”, were significantly greater in number in the ischemic penumbra at the borderline (* P < 0.05 vs. vehicle; Student’s t-test; n = 3) in the DAEE-treated group than in the vehicle-treated group. However, in the other 2 areas (normal and ischemic), there were no significant differences between the 2 groups (vs. vehicle; Student’s t-test; n = 3).


