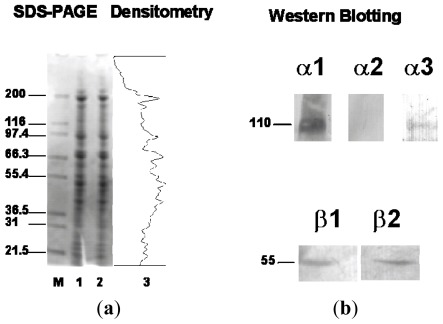
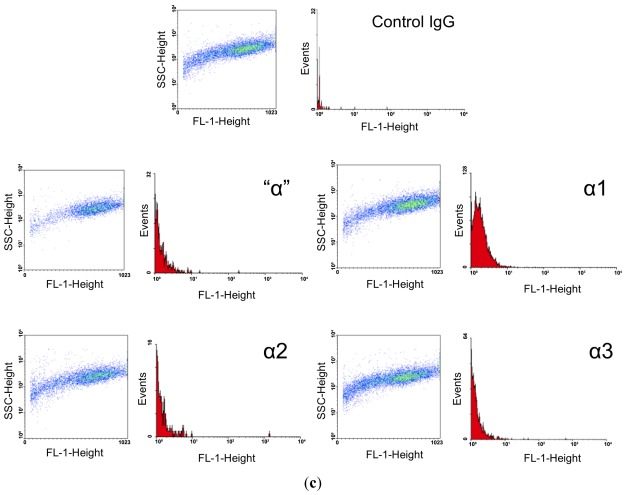
Figure 2.
(a) Electrophoretic separation of human chondrocyte microsomes using Coomassie blue stained NuPAGE polyacrylamide gel. Molecular weight markers are shown in kDa (lane M) together with human chondrocyte plasma membrane enriched microsomal fractions (lanes 1 and 2). Lane 3 is a representative densitometric scan of the membrane proteins resolved in lane 2 and shows that most of the membrane proteins expressed in human chondrocyte-like cells are between 30 and 200 kDa markers with large aggregate peaks around 200, 95, 68 and 50 kDa. (b) Western blots showing expression of Na+, K+-ATPase isoforms in human chondrocyte-like cells; α1 and α3 (110 kDa), β1 and β2 (55 kDa) and the absence of α2. (c) FACS analysis of chondrocytes immunostained with monoclonal antibodies to the α subunit of Na+, K+-ATPase. In each panel the density plot on the left shows the size distribution of the cells analyzed and the histogram on the right shows the FITC positive cells as a frequency distribution. The highest FITC staining was observed with the α1 specific antibody followed by the pan α antibody. The lowest staining was observed with the non-immune control anti-mouse IgG followed by α2 and α3 specific antibodies.


