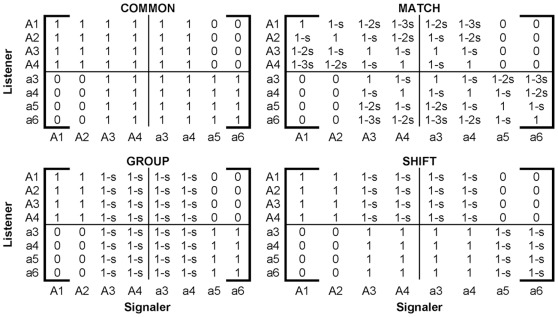
Figure 1. Affinity schemes.
The matrices represent the relative weight that a listener of phenogenotype i gives to a singer of phenogenotype j for each of the four affinity schemes. The phenogenotypes of listeners and receivers are labeled on the schemes. Break lines have been included to group cases by genotype. The variable s describes a reduction in the affinity. Default values of s are: Match, s = .1; Group or Shift, s = .25. The Common scheme is equivalent to any of the above schemes with s = 0.

