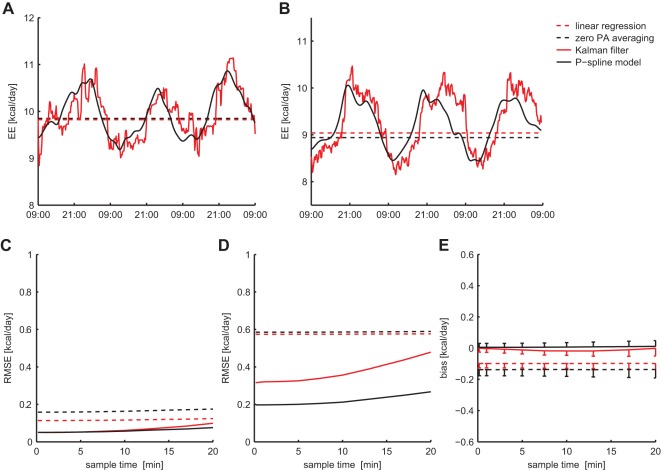
Figure 5. Performance comparison of estimation methods.
Estimated RMR time series by means of linear regression, TEE averaging for zero activity, Kalman filtering and penalised spline modelling are shown for a typical simulated (A) and experimental (B) dataset. The overall estimation accuracy in average RMR (C) and time-dependent RMR (D) was calculated based on 500 simulated datasets (expressed as Root Mean Square Error). For the estimation error in the average RMR the bias-variance decomposition was calculated to gain more insight in the origin of the error (E). Error bars indicate half the standard deviation.

