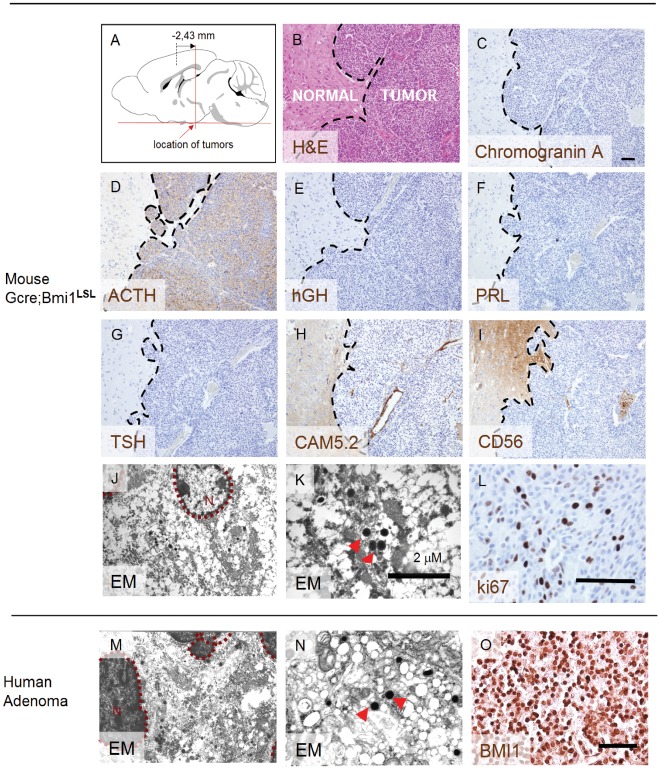
Figure 3. Histology of a representative example of a typical pituitary tumor as found in this study.
(A) Average location of pituitary tumors observed in the GCre;Bmi1LSL mice showing localization to the pituitary gland (n = 6). Localization is based on Allen’s mouse brain database, (B) H&E staining of a coronal section of the brain showing a typical pituitary tumor. Immunohistochemistry shows expression analysis of (C) Chromogranin A, (D) adrenocorticotropic hormone ACTH, (E) Growth Hormone hGH, (F) Prolactin PRL, (G) Thyroid Stimulating Hormone TSH, (H) cytokeratin 8/18 CAM5.2 and (I) CD56/NCAM. Of these markers, ACTH is clearly positive in this tumor. Electron microscopy (EM) shows secretory vesicles (indicated by the arrowheads) in Bmi1 transgenic tumors (J, K) in a similar way as observed in human tumors (M, N). Ki67 is clearly positive in this tumor (L). Immunohistochemistry of human pituitary adenomas show over expression of BMI1, which is visualized by a nuclear signal (O). Bars, 100 µm unless otherwise noted.

