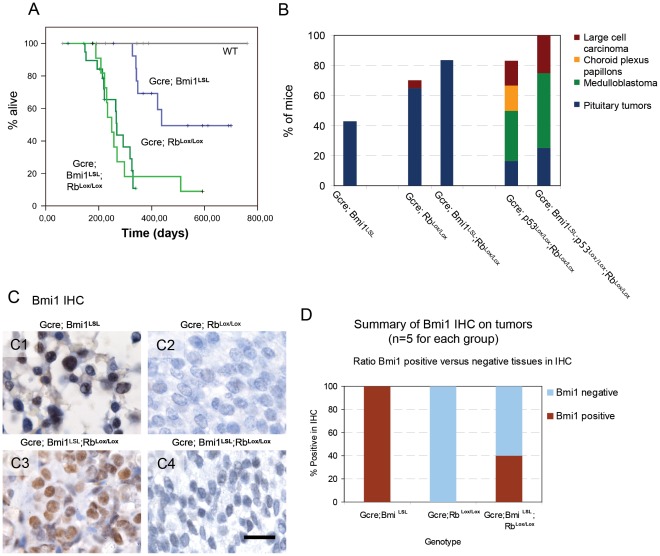
Figure 4. Transgenic expression of Bmi1 is sufficient to induce intermediate and anterior lobe pituitary tumors but does not induce medulloblastoma or glioma.
(A) Kaplan Meier survival curves of mice carrying tumors because of GCre induced transgenic expression of Bmi1 complemented with loss of Rb. These data show that Bmi1 transgenic mice develop pituitary tumors after about one year. Pituitary tumors are also observed in RbLox/Lox and Bmi1LSL;RbLox/Lox transgenic mice. (B) Histograms showing the relative frequency and penetrance of tumors generated by the individual genotypic groups. All genotypes shown are GCre positive. Total cohort size: GCre;Bmi1LSL n = 14, GCre;RbLox/Lox n = 20, GCre;RbLox/Lox;Bmi1LSL n = 12, GCre;p53Lox/Lox;RbLox/Lox n = 6, GCre;p53Lox/Lox;RbLox/Lox; Bmi1LSL n = 4, WT mice did not develop tumors, n = 7. (C) IHC results showing transgenic Bm1 expression in tumors raised on a GCre;Bmi1LSL background (5/5), no expression in tumors raised on a Gcre;Rblox/lox background (0/5) while some of the GCre;Bmi1LSL; Rblox/lox mice were positive (2/5, 40%). These results are summarized in a histogram (D). Bar is 50 µm.

