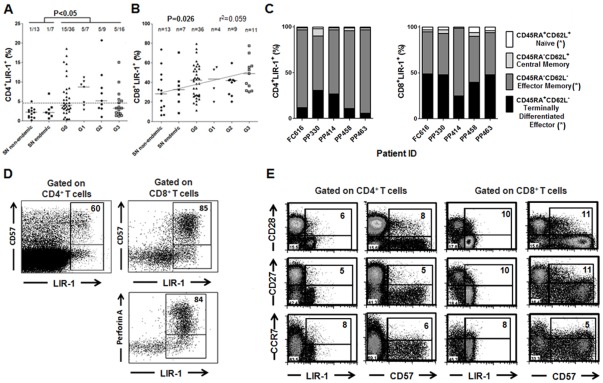
Figure 3. Frequencies of total LIR-1+ T cells in the circulation of chronically T. cruzi-infected subjects and uninfected controls.
PBMCs were isolated by density gradient centrifugation on ficoll-hypaque and stained with anti-CD4, anti-CD8 and anti-LIR-1 monoclonal antibodies. Each point represents the percentage of CD4+LIR-1+ (A) and CD8+LIR-1+ (B) T cells in individual subjects. SN non-endemic: subjects with negative serology who had not lived in areas endemic for T. cruzi infection; SN endemic: subjects with negative serology born in endemic areas; G0, G1, G2 and G3: clinical groups of chronically infected subjects as defined in Material and Methods. Median values are indicated by the horizontal lines. A cut off value for CD4+LIR-1+ T cells (dotted line) was set as the mean percentage ±2SD from uninfected subjects. The number of subjects with values above the cut off out of the total number of subjects evaluated is shown. A positive trend in the percentages of CD8+LIR-1+ T cells as disease becomes more severe is also shown. (C) Expression patterns of LIR-1 in total CD4+ CD8+ T cells. PBMCs from 4 G0 (FC616, PP414, PP458 and PP463) and 1 G1 (PP330) patients were stained with anti-CD8, anti-CD45RA, anti-CD62L and anti-LIR-1 monoclonal antibodies. The bars represent the percentages of LIR-1-expressing naïve, effector, effector memory and central memory CD4+ (left panel) and CD8+ (right panel) T cells out of total CD4+LIR-1+ or CD8+LIR-1+ T cells. (*) P<0.05 between CD8+ and CD4+ T cells for the corresponding T cell compartment expressing LIR-1. The percentages of (D) Representative perforin A and CD57 expression profiles by CD4+LIR-1+ (upper panel) or CD8+LIR-1+ (bottom panel) T cells. The percentages in the upper right quadrants show the expression of perforin A (left panel) and CD57 (right panel) by CD4+LIR-1+ or CD8+LIR-1+ T cells. Representative CD28 (top panel), CD27 (middle panel) and CCR7 (low panel) expression profiles by CD4+LIR-1+ (left panel) or CD4+CD57+ (right panel) (E), and CD8+LIR-1+ or CD8+CD57+ (F) T cells. The percentages in the upper right quadrants show the expression of the indicated molecules by CD4+LIR-1+ or CD8+LIR-1+ T and CD4+LIR-1+ or CD8+CD57+ T cells.

