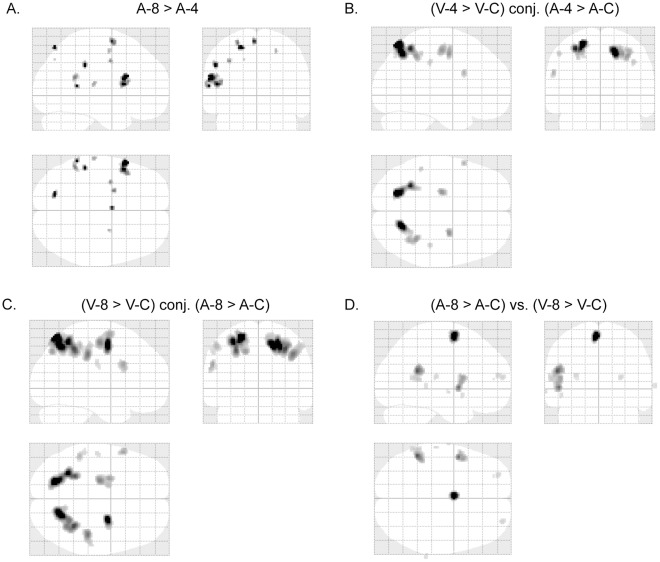
Figure 8. fMRI results revealing difficulty and modality effects.
(A) Glass-brain views of fMRI activated areas of A-8 vs. A-4 (p<0.05, family-wise-error corrected). Talairach coordinates of the activated points are listed in table 7. (B) Glass-brain views of fMRI activation conjunction between V4/VC and A4/AC (p<0.05, family-wise-error corrected). (C) Glass-brain views of fMRI activation conjunction between V8/VC and A8/AC (p<0.05, family-wise-error corrected). (D) Glass-brain views of fMRI activated areas of A8/AC vs. V8/VC (p<0.05, family-wise-error corrected). Talairach coordinates of the activated points are listed in table 8.

