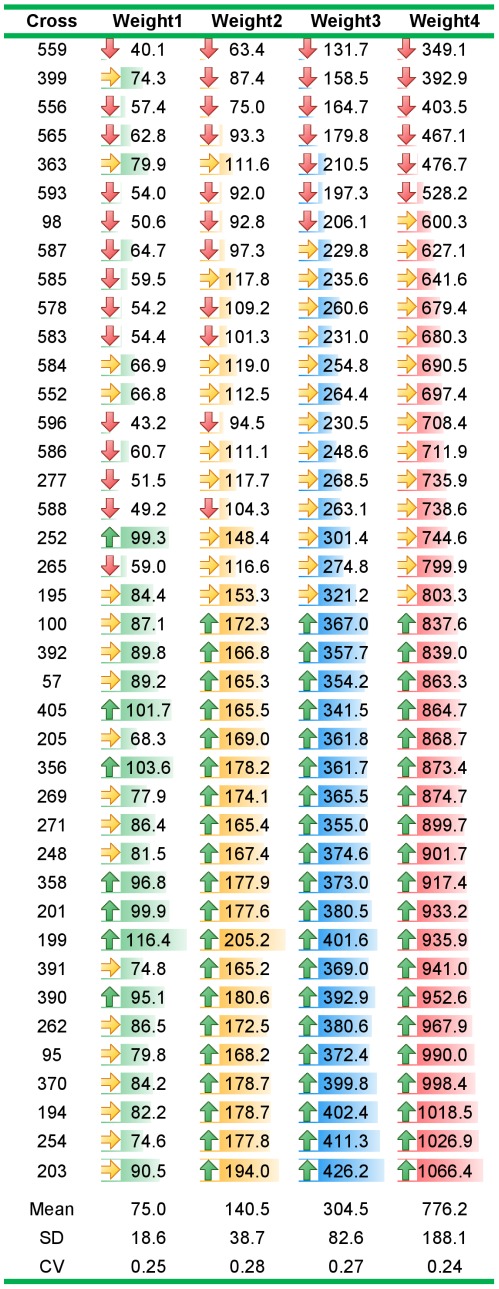
Figure 2. Variation in average family body weight (BW) measured in grams at approximately 6, 7, 9 and 12 months post-hatching (Weight1, Weight2, Weight3 and Weight4). CV (SD/mean) indicates the phenotypic coefficients of variation.
Color intensities (green, blue and red) reflect changes in mean of BWs of different families at Weight1, Weigh2 and Weight3, respectively. Up/right/down arrows indicate families’ mean BWs lie within top, middle and bottom 33% of the population at each age, respectively.

