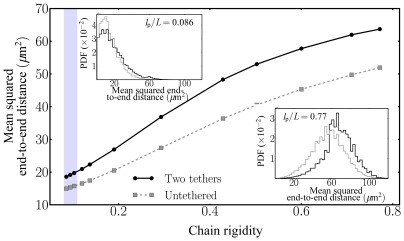
Figure 2. Mean squared end-to-end distance  as a function of chain rigidity
 for the double-tethered SC polymer model (“Two tethers”) as well as for the “null” model of free polymers (“Untethered”).
The insets show the probability density function (PDF) of the end-to-end distance for the flexible regime  as well as for the stiff case
  . Semiflexible end-tethered polymers are forces to stretch out between the (moving) attachment sites, leading to larger mean end-to-end distances in agreement with visual inspection of the SC's end-to-end distances in 4Pi-microscopy images. The shaded region indicates the range of bending rigidity that generates the experimentally observed mean squared end-to-end distance of
  .
.

