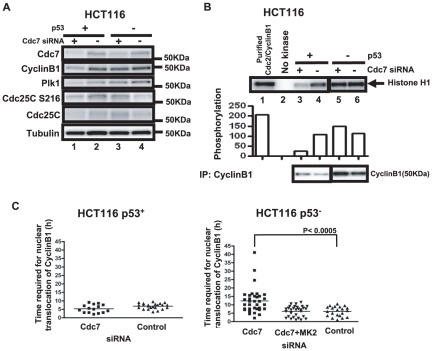
Figure 7. The CyclinB1 protein level and Cdc2-CyclinB1 kinase activity decrease in p53-positive HCT116 cells after Cdc7 depletion.
(A) p53-positive or -negative HCT116 cells were treated with control or Cdc7-D siRNA for 48 hrs, and whole cell extracts were analyzed by western blotting. (B) CSK-soluble extracts were prepared from the same cells as in (A) and immunoprecipitation was conducted with anti-CylinB1 antibody. Cdc2-CyclinB1 kinase activity was measured with Histone H1 as a substrate (upper panel), as described in “Materials and Methods”. The graph below shows quantification of the level of phosphorylation. Lower panel, western blotting analyses of CyclinB1 proteins in the immunoprecipitates used for kinase assays. (C) p53-positive (left) or -negative (right) HCT116 cells expressing mKO2-CyclinB1 were treated with indicated siRNA and time lapse images were recorded. The time (hr) between the first appearance of cytosolic mKO2-CyclinB1 signal and its translocation into the nucleus was measured in the time lapse images. The P-values of the two-tailed unpaired t-test was calculated by Prism software.

