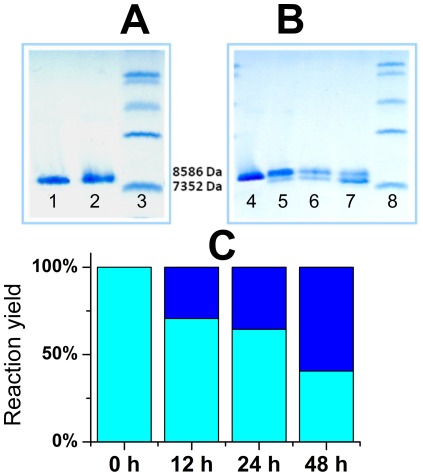
Figure 7. Electrophoretic analysis of Ni(II) hydrolysis of Ubi.
(A) native conditions, 100 µM Ubi incubated at 50°C in 20 mM Tris, pH 8.2 for 0 h in the absence of Ni(II) (lane 1), 100 µM Ubi incubated at 50°C for 24 h in the presence of 5 mM Ni(II) (lane 2), low-range protein molecular weight marker (lane 3); (B) denaturating conditions, 100 µM Ubi incubated at 50°C and pH 8.2 in the presence of 5 mM Ni(II) and 5 M GuHCl for 0 h (lane 4), 12 h (lane 5), 24 h (lane 6), and 48 h (lane 7); low-range protein molecular weight marker (lane 8) (C) densitometric analysis of gel (B).

