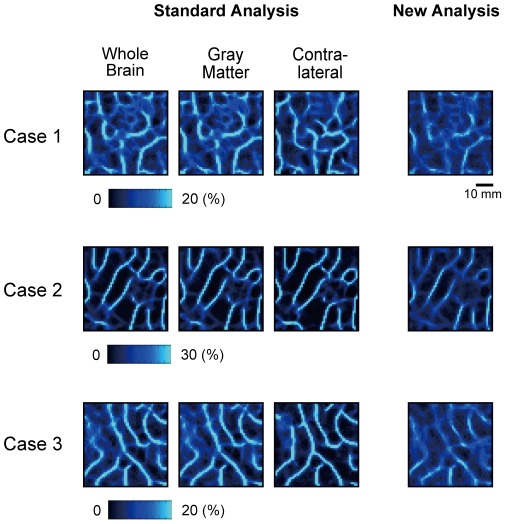
Figure 4. Boundary patterns in the right pIFC generated by the standard analysis (left) and the new analysis (right) in three individual subjects.
In the standard analysis, the correlation map was calculated for the whole brain, the gray matter in the entire cerebral cortex, or the region contralateral to the right pIFC.

