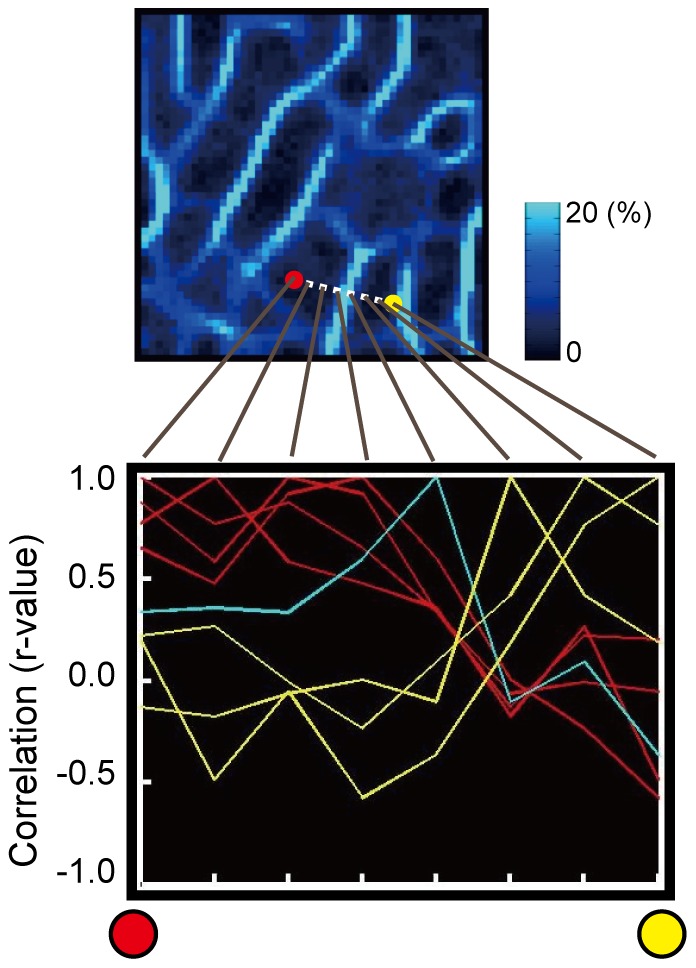
Figure 5. A spatial profile of correlation coefficient between signal timecourses along the line that crossed a representative boundary.

The red and yellow curves indicate the spatial profiles that belonged to the same areas as the red and yellow dots, respectively.
