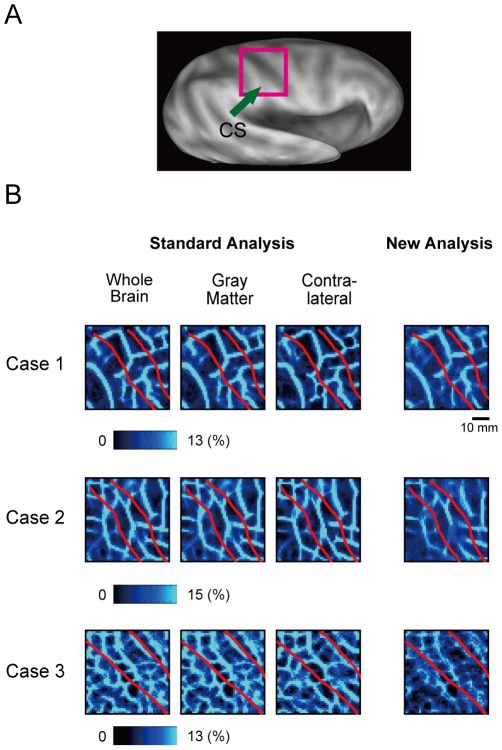
Figure 6. The probabilistic boundary maps around the right central sulcus.
A) An inflated brain and the region of interest, the right central sulcus. CS: central sulcus. B) Boundary patterns in the right CS generated by the standard analysis (left) and the new analysis (right) in three individual subjects. The format is similar to Fig. 4. Red curves indicate the approximate location of the dips of the CS.

