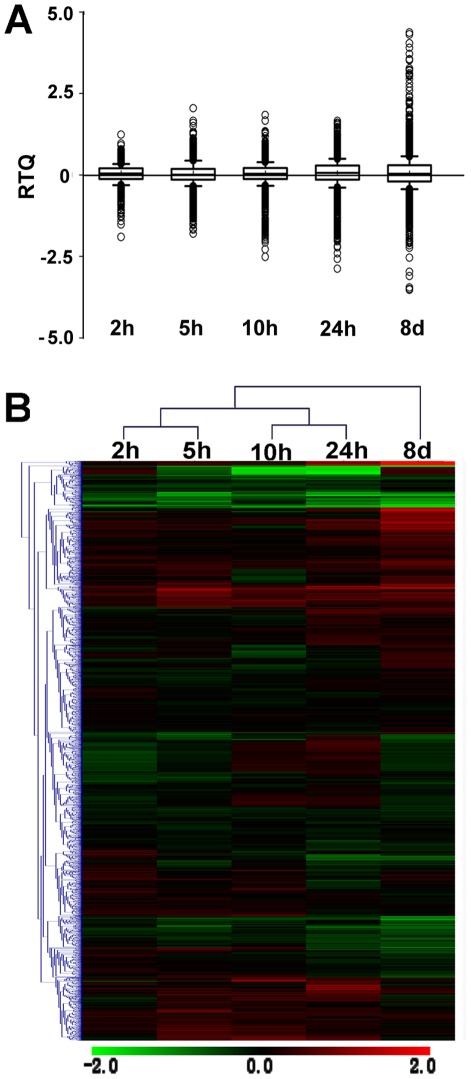
Figure 1. Global transcript profiles in the roots of salt-shocked C. tagal seedlings.
A. The distribution spectrum of the RTQ (Relative Transcript Quantity) values of the whole set of investigated genes. The RTQ is defined as the log2-transformed fold change associated with each probe on the microarray chip. The RTQ values are ranked along the Y-axis, the box encloses those values between the 25th and 75th percentiles (the lower and upper quartiles, respectively), and the values between the 95th and 5th percentiles are enclosed by the up and down bars. The line near the middle of the box indicates the median value (the 50th percentile). The circles indicate the outliers. B. Overview of the entire hierarchical clustering of the probes at all five time points. The heat maps display the transcript profiles by the log2-transformed fold changes on a color scale from green, indicating lower expression, to red, indicating higher expression, interpolated over black for the log2 (intensity ratio) = 0. Both the stress time points and probes/genes were clustered based on Euclidean distances.

