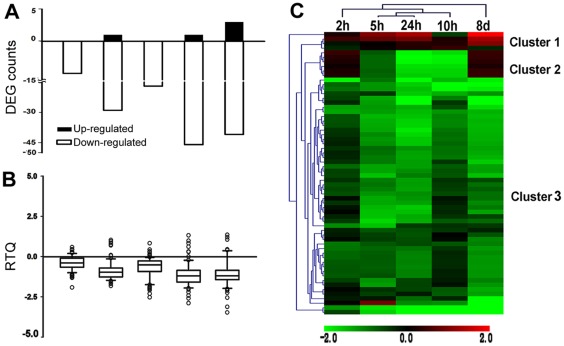
Figure 3. Transcript profiles of differentially expressed genes (DEGs).
A. The dynamics of the number of differentially expressed genes (DEGs). Positive and negative values indicate the number of up- and down-regulated genes, respectively. B. Distribution spectrum of the RTQ (Relative Transcript Quantity) values of the DEGs. C. Transcript profiles of differentially expressed genes (DEGs). The heat maps illustrate the transcript profiles by the log2-transformed fold change on a color scale from green, indicating lower expression, to red, indicating higher expression, interpolated over black for the log2 (intensity ratio) = 0. Both the stress time points and probes/genes were clustered based on Euclidean distances.

