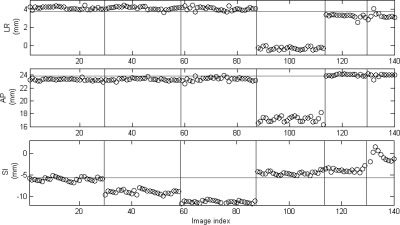
Figure 5.
3D position (circles) of one of the fiducial markers estimated from the kV images acquired during treatment for the phantom study. The horizontal lines indicate the reference position of the marker defined in planning CT. The vertical lines separate the six different treatment fractions as described in Table TABLE I..

