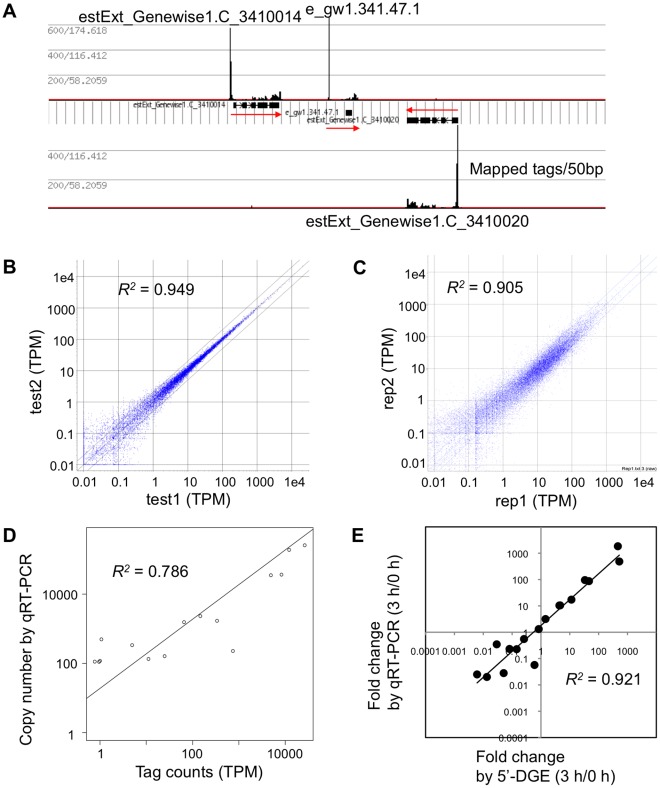
Figure 3. Qualitative and quantitative nature of the 5'-DGE tags.
(A) Tags mapped to reverse and forward strands, representing forward- and reverse-strand transcripts, are shown in the upper panel and lower panel, respectively. Exons and introns of three gene models are shown by black boxes and horizontal lines. The values given on the left define the level of raw tag/normalized tag (genome average = 1). (B) Scatter plot of technical replicates (test1 and test2) in tags per million (TPM). (C) Scatter plot of biological replicates (rep1 and rep2). (D) Correlation between tag counts and the copy number per 0.1 ng polyA RNA measured by qRT-PCR (test1 sample). (E) Correlation of fold changes measured by SOLiD-DGE tags and by qRT-PCR. The ratios between 0 and 3 h samples were compared.

