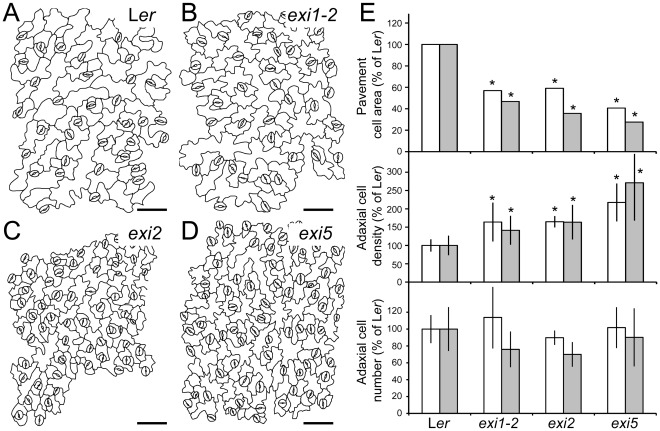
Figure 2. Leaf adaxial epidermis in the exi mutants.
(A–D) Representative diagrams from the leaf adaxial epidermis of exi mutants. Diagrams were drawn from the differential interference contrast images of cleared third-node leaves collected from (A) Ler, (B) exi1-2, (C) exi2 and (D) exi5 plants. (E) Adaxial pavement cell area, cell density and cell number in first-node (white bars) or third-node (grey bars) leaves of the exi mutants. Data were normalized with respect to the Ler value and are expressed as percentages. Represented values are the mean and the standard deviation, except for the pavement cell area, which did not exhibit a normal distribution and for which the median was used. Asterisks indicate significant differences from the Ler control (P value<0.05; n = 11–15). All the data were obtained at 21 DAS from plants grown on half-strength MS agar medium. Scale bars indicate 50 µm.

