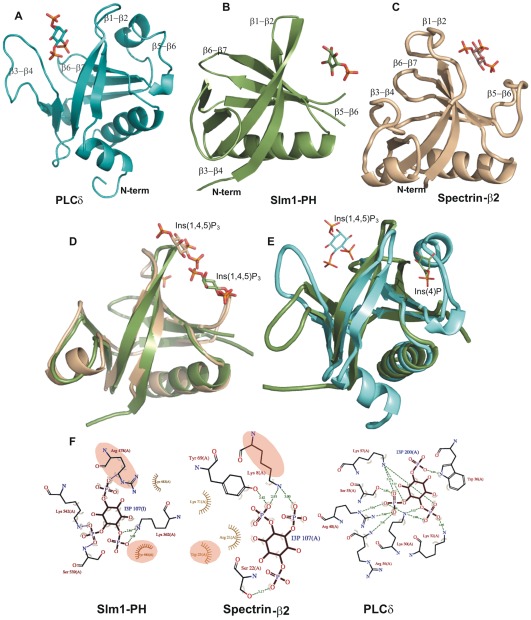
Figure 5. Comparison of canonical and non-canonical binding sites.
(A) Structure of the PLCδ (1MAI.PDB) in steel blue with bound Ins(1,4,5)P3 in the canonical binding site, which is formed by β1-β2, β3-β4 and β6-β7 loop regions; (B) Cartoon representation of Slm1-PH in green, Ins(4)P is bound in the non-canonical binding site; (C) Structure of the β-spectrin PH domain (1BTN.PDB) in wheat color with bound Ins(1,4,5)P3 again in the non-canonical binding site. (D) Superposition of the Slm1-PH (green) modeled with Ins(1,4,5)P3 onto the β-spectrin PH domain (wheat) and (E) onto PLCδ (cyan) (F) LIGPLOT representation [38] showing residues involved in ligand binding in the non-canonical binding site (Slm1-PH and β-spectrin) and the canonical binding site (PLCδ). The conserved residues between PH domains of Slm1 and β-spectrin involved in ligand binding are highlighted in pale yellow.

