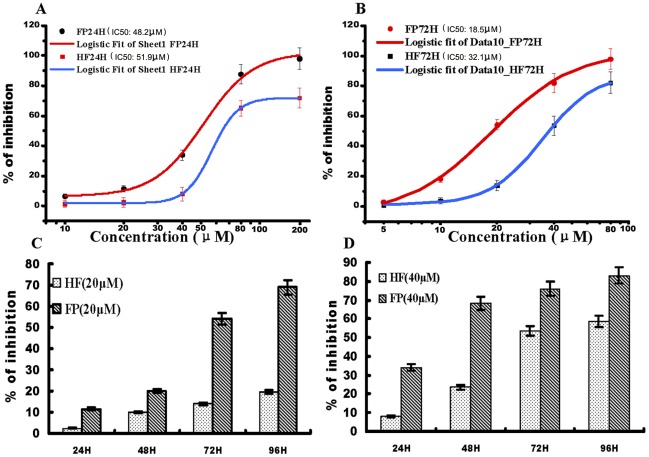
Figure 1. Effects of test compounds on cell growth inhibition.
A) Effects of test compounds at different concentrations on HeLa cells following treatment for 24 h. IC50 values for FP and HF at 24 h were 46.8 and 56.9 µM, respectively. B) Effects of test compounds at different concentrations on HeLa cells following treatment for 72 h. IC50 values for FP and HF at 72 h were 18.5 and 32.1 µM, respectively. C) Effects of 20 µM HF and FP on cell viability following treatment for 24, 48, 72 and 96 h. D) Effects of 40 µM HF and FP on cell viability following treatment for 24, 48, 72 and 96 h. All data points represent mean ± SEM values.

