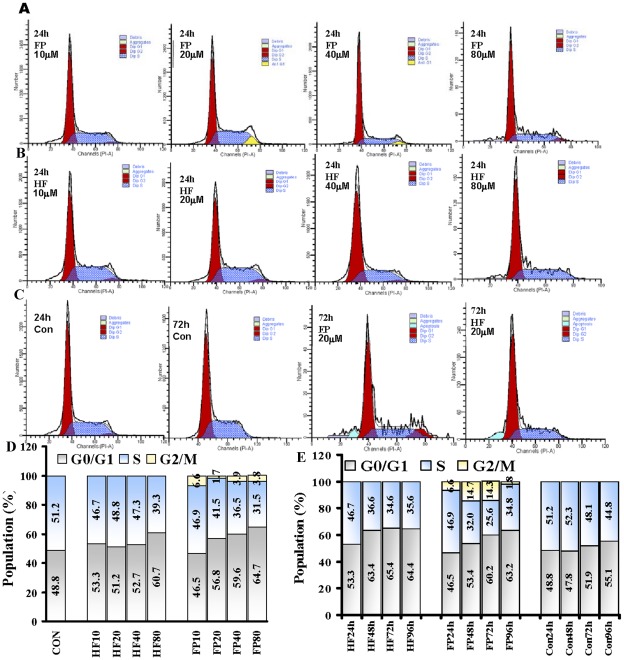
Figure 2. Effects of FP/HF on cell cycle distribution.
HeLa cells were treated with different concentrations of FP/HF for 24, 48, 72 and 96 h. Cells were harvested and stained with propidium iodide. Cell cycle distribution was analyzed using a BD FACSCanto II flow cytometer. The distributions of cells in G0/G1, S, and G2/M phases were determined using Modfit software. A) Representative cell cycle distributions after treatment with FP at 10, 20, 40 and 80 µM for 24 h. B) Representative cell cycle distributions after treatment with HF at 10, 20, 40 and 80 µM for 24 h. C) Representative cell cycle distributions after treatment with 20 µM FP/HF at 72 h and control at 24 and 72 h. D) G0/G1, S and G2/M population percentages in each group following treatment with 10, 20, 40 and 80 µM HF or FP for 24 h. E) G0/G1, S and G2/M population percentages in each group following treatment with 20 µM HF or FP and control group for 24, 48, 72 and 96 h.

