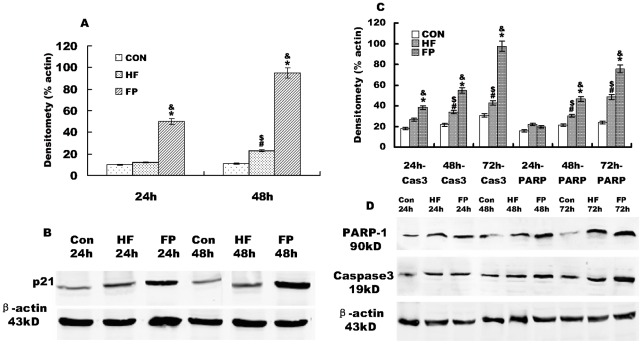
Figure 5. Effects of HF and FP on p21, caspase-3, and PARP in Hela cells by western blotting analyses.
A) Histogram representing p21. B) Representative western blots of p21/Waf1 in FP, HF and control groups after 24 and 48 h. C) Histogram representing cleaved caspase-3 (19 kD) and cleaved PARP-1 (90 kD). D) Representative western blots of cleaved caspase-3 and cleaved PARP-I in the FP, HF and control groups after 24, 48 and 72 h. Total extracts obtained from HeLa cells without HF or FP treatment (Con), with 20 µM HF treatment (HF) and with 20 µM FP treatment (FP) were subjected to western blot analysis as described in Materials and Methods. The densitometry measurements represent the amount of p21, caspase 3, and PARP1 relative to β-actin and are given as means from triplicate experiments expressed as % of β-actin ± SE. β-actin was used as a loading control. *p<0.001 versus control cells; #p<0.01 versus control group; $ p<0.01 versus FP group; & p<0.01 versus HF group.

