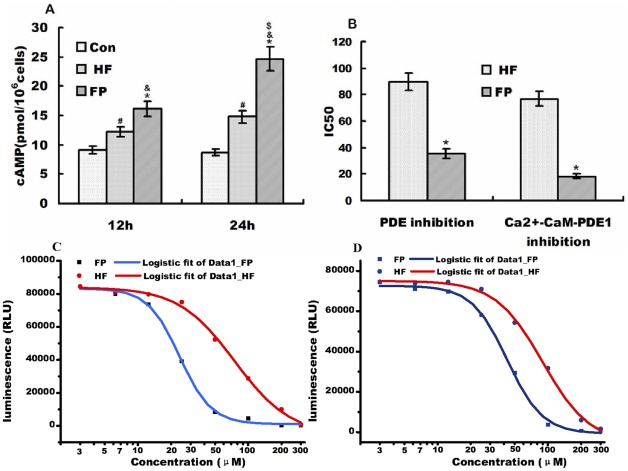
Figure 6. cAMP levels in Hela cells in each group and PDE inhibition activities in vitro.
A) cAMP concentrations in Hela cells in each group at 12 and 24 h. CON, control; HF, 20 µM HF group; FP, 20 µM FP group. B) Histogram representing inhibitory effects of FP and HP on PDE and CaM-activated PDE1 activity. C) Inhibitory effects of FP and HP on CaM-activated PDE1 activity. D) Inhibitory effects of FP and HP on PDE activity from bovine brain. Values are given as mean ± SE; RLU (relative light units) on the y axes of panels C and D is positively related with CaM-activated PDE1 or PDE activities. The IC50 was calculated by using a sigmoidal dose-response (variable slope) equation analysis. & p<0.01 versus control group; *p<0.001 versus HF group; # p<0.01 versus control group; $ p<0.01 versus 24 h FP group.

