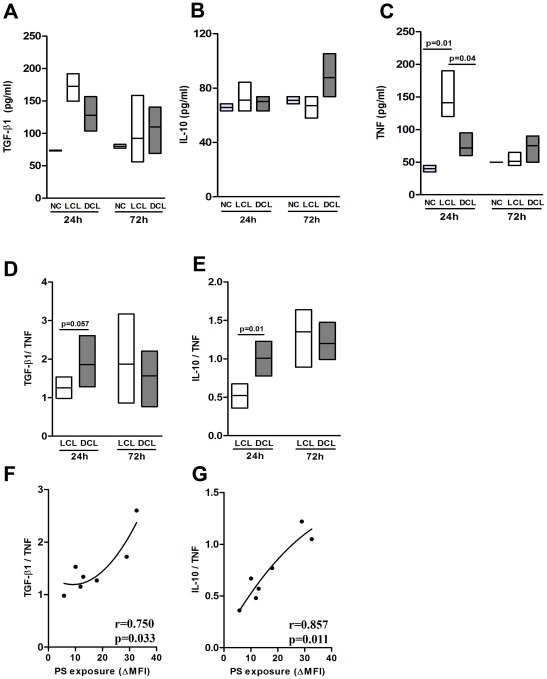
Figure 3. Cytokine production by infected macrophages with different Leishmania amazonensis isolates.
Peritoneal macrophages of F1 mice were infected with isolates obtained from LCL (BA69, BA73, BA 125, and M2269) (□) and DCL (BA276, BA336, and BA700) patients in a serum-free medium containing 100 ng/ml LPS. Negative control (NC) represents uninfected macrophages. Supernatants were collected after 24 and 72 h and active TGF-β1 (A) production was assayed by ELISA. IL- 10 (B) and TNF-α (C) production were assessed by Cytometric Bead Array (CBA). The TGF-β/TNF-α (D) and IL-10/TNF-α (E) ratios. Boxes represent median values and interquartile interval of the ratios from different isolates mentioned above. The correlations between PS exposure at 24 h with TGF-β/TNF-α and IL-10/TNF-α at 24 h are showed in (F) and (G), respectively. The four lower points in X axis (PS exposure) represents LCL isolates while the three higher points are from DCL isolates. Differences were checked using Kruskal-Wallis with Dunn's multiple comparison post test. Spearman test was used to verify the significance in the correlations between cytokine ratio and PS exposure. The r values are plotted in each correlation graph.

