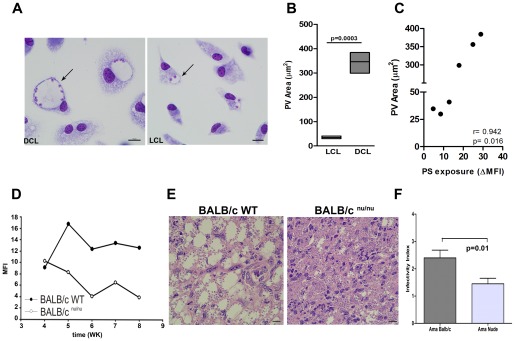
Figure 4. Parasitophorous vacuole analysis.
Photomicrographs of macrophages from F1 mice, infected with DCL (BA276) and LCL (BA125) isolates after 72 h of culture (A). Arrows point to individual PVs. Magnification 400X. The average sizes of the PVs induced by different isolates from patients with LCL (BA69, BA73 and BA 125) (□) and DCL (BA276, BA336, and BA700) (▪) after 72 h of infection were measured using Image-Pro Plus 6.0 (B). Data are shown as the area in μm2 of PVs in each tested isolate. Boxes represent median values and interquartile interval of PV sizes pooled from different isolates mentioned above. The correlation between PS exposure at 24 h and PV area showed in (C). The three lower points in X axis (PS exposure) represents LCL isolates while the three higher points are from DCL isolates. Differences were checked using unpaired t test. Spearman test was used to verify the significance in the correlations between PV area and PS exposure. The r value is plotted in the correlation graph. PS exposure on the L. amazonensis amastigotes surface from nude mice (Figures D–F). Mean fluorescence intensity of annexin V staining on lesion-derived amastigotes (LV79) purified from BALB/c WT or BALB/c nu/nu mice (D). Graph corresponds to one representative experiment out of three. H&E staining of histological slides of infected footpads obtained from BALB/c WT or BALB/c nude mice 5 weeks post infection (E). Peritoneal macrophages derived from BALB/c mice were infected with lesion-derived amastigotes (LV79) purified from BALB/c WT or BALB/c nu/nu mice 5 weeks post infection. After 24 h of infection cells were fixed and stained. The infectivity index (F) was defined by microscopic analysis. Representative experiment of two repeats. Differences were checked using unpaired t test.

