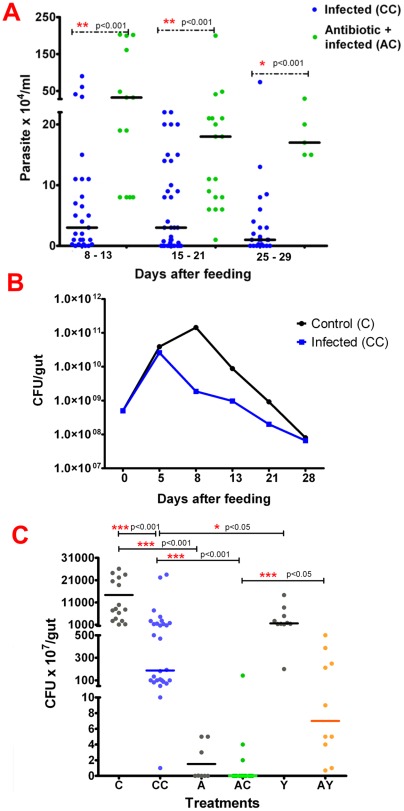
Figure 1. Parasite infection and microbiota population in Rhodnius prolixus 5th-instar nymphs digestive tract challenged by Trypanosoma cruzi Dm28c clone.
(A) Parasite infection at different days after infection. (B) Microbiota population at different days after feeding. (C) Microbiota population 8 days after feeding. Treatments: C – control insects fed on blood alone; CC – insects infected with T. cruzi Dm28c clone; A – insects treated with antibiotic alone; AC- insects treated with antibiotic and infected with the Dm28c parasites; Y- insects infected with T. cruzi Y strain; AY–insects treated with antibiotic and infected with T. cruzi Y strain. In figures A and C each point represents the number of parasites or bacteria in an individual digestive tract, and horizontal lines indicate the median. In figure B each point represents the median. In figure C the median for antibiotic treated and infected insects (AC) is zero and therefore overlaps the x axes. Treatments were repeated 3–5 times with 6–10 insects in each experiment reaching a total of 25 to 35 insects for each group. Medians were analyzed with 1 way ANOVA and Mann Whitney test.

