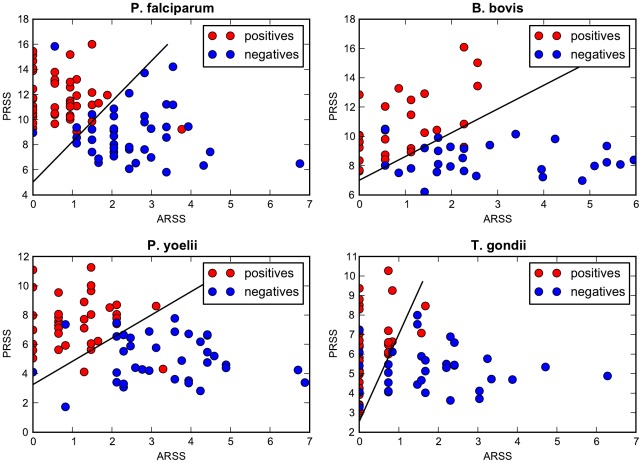
Figure 3. Training data mapped onto the PRSS-ARSS plane using final ApicoAP classifiers.
This figure shows how training data are mapped onto the PRSS-ARSS plane when the final ApicoAP classifiers are applied. The preferred residue set score (PRSS) and avoided residue set score (ARSS) quantify the existence of preferred residue set (PRS) and avoided residue set (ARS) elements in the p regions of the training sequences for each organism. See Eqs. (1) and (2) for definitions. The discriminating lines are shown on each plot, where the PRSS-intercept of each line corresponds to the estimated limiting value lv, given by Eq. (4), and the slope of each line corresponds to the estimated threshold value over the p-criterion values, given by Eq. (3).

