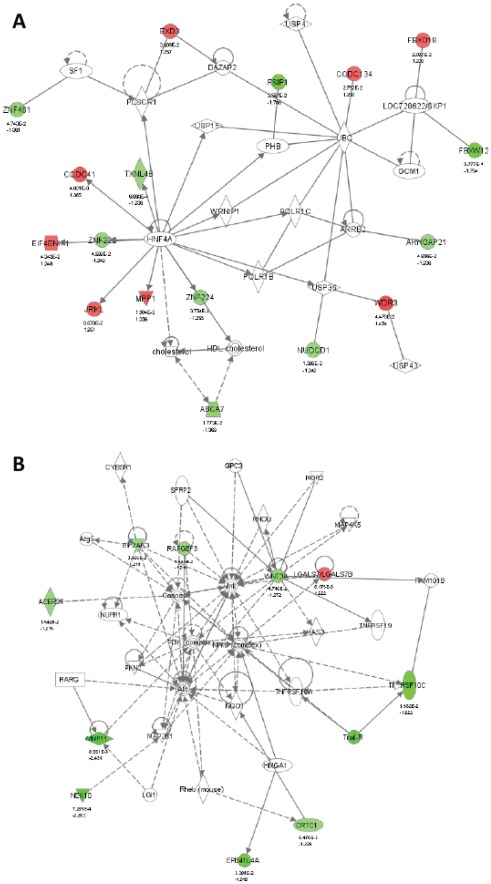
Figure 2. Network associated genes differentially expressed in response to BPA.
(A) “Endocrine System Disorders, Gastrointestinal Disease, Genetic Disorder” network and (B) “Cell Death, Cellular Growth and Proliferation, Cancer” network. The images were created using the IPA platform by overlaying the differentially expressed genes in response to BPA detected by Agilent microarray analysis onto a global molecular network from the Ingenuity knowledgebase. Red indicates upregulated genes, green indicates downregulated genes, and white indicates genes that were not annotated in this array but that form part of this network. The bottom numbers indicate the fold changes induced by BPA, and the top numbers are the P-values between the DMSO control group and the BPA treated group. Direct relationships are exhibited with solid arrows and indirect relationships with dashed arrows.

