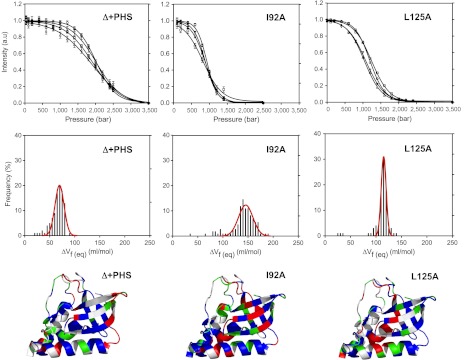
Fig. 3.
Pressure unfolding monitored with NMR spectroscopy. (Top): Examples of HSQC cross-peak intensity profiles for four representative residues of the Δ + PHS variant at 1.5 M GuHCl (Left), I92A at 0.85 M GuHCl (Middle), and L125A at 0.85 M GuHCl (Right). (Middle Panel): Distributions of the ΔVf( = -ΔVu) values obtained from high-pressure NMR spectroscopy experiments for Δ + PHS (Left), I92A (Middle), and L125A (Right). (Lower Panel): Structural mapping of the ΔVf values obtained from high-pressure NMR experiments for Δ + PHS (Left), I92A (Middle), and L125A (Right). Residues of the first quartile (the 25% lowest values) are in green; residues of the third quartile (25% highest values) are in red; and residues lying between the first and the third quartile (50% of the values) are in blue.

