Fig. 2.
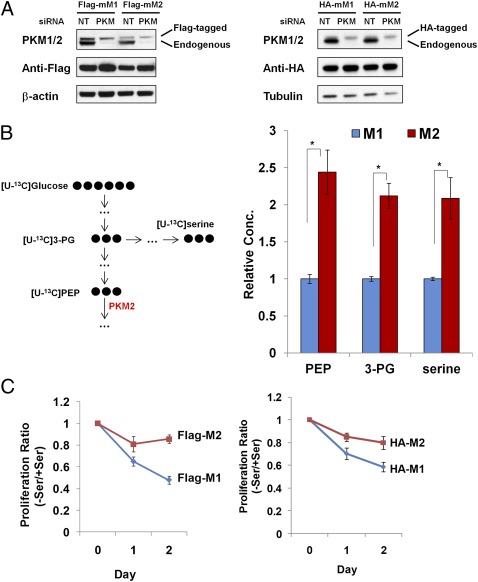
PKM2 expressing cells are more resistant to serine starvation than PKM1-expressing cells. (A) To generate cell lines expressing PKM1 or PKM2, H1299 cells expressing Flag-tagged (Left) or HA-tagged (Right) mouse PKM1 or PKM2 were transiently transfected with 20 nM nontargeting siRNA (NT) or PKM siRNA. After 48 h, PKM1/2 expression was measured using immunoblot. (B) The levels of [U-13C] PEP, [U-13C] 3-PG, and [U-13C] serine in Flag-M1/M2 cells were measured using LC-MS. Flag-M1/M2 cells were incubated in serine-free medium for 24 h and then labeled with [U-13C6] glucose for 3 h. This process results in essentially complete labeling of PEP and 3-PG; thus, the data for these metabolites reflect total cellular concentrations. For serine, labeling is incomplete and the enhanced labeling reflects increased flux (data represent mean ± SEM, n = 3). *P < 0.05, two-tailed Student t test. (C) PKM2 confers resistance to serine starvation. Flag-M1/M2 (Left) or HA-M1/M2 (Right) cells were incubated with or without serine for 24 or 48 h, and cell proliferation was measured using an MTT assay. The ratios of proliferation between (−) serine and (+) serine media were calculated and plotted (data represent mean ± SEM, n = 3).

