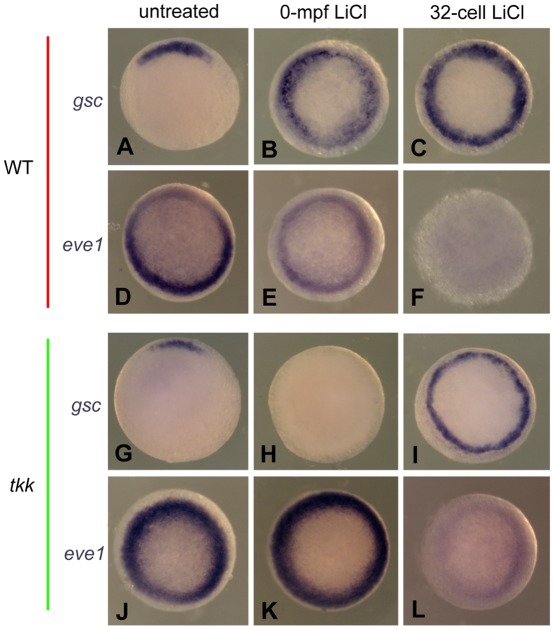
Figure 4. The comparison of dorsal and ventral gene expression between 0-mpf lithium treatment and 32-cell-stage lithium treatment.
Representative embryos from indicated groups stained by gsc probe (A–C, and G–I) or eve1 probe (D–F and J–L) at 50% epiboly. All the embryos are animal pole view and with dorsal side upward if it can be distinguished.

