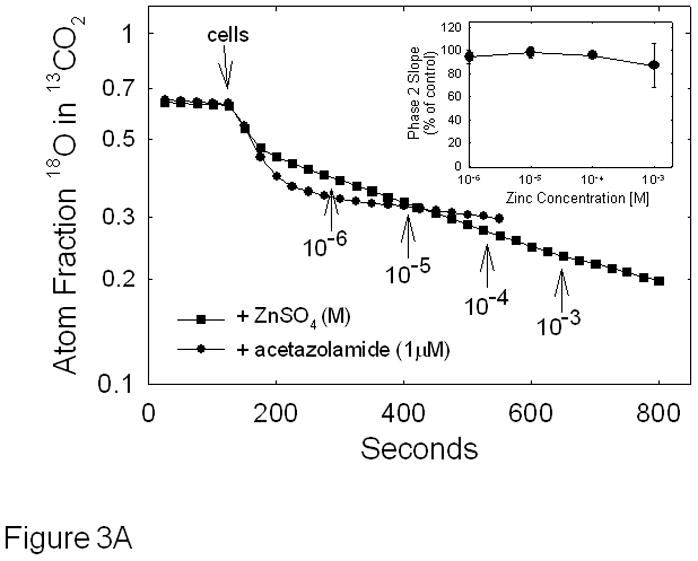
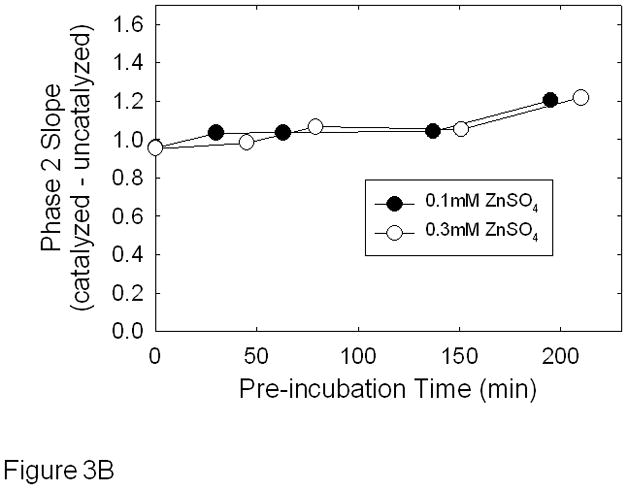
Figure 3.


Effect of zinc on CAIX activity in hypoxic MDA-MB-231 cells - Cells were grown and harvested as described in Figure 1. Panel A: Cells were assayed for carbonic anhydrase activity using the 18O exchange assay and the effect of zinc was determined after initiating the activity assay. The time and concentration of zinc additions are indicated on the figure. These data are representative of two independent experiments. The inset shows the dose response curve in which the average slope data ± SE are presented as percent of control. Panel B: Cells were exposed to either 0.1 mM or 0.3 mM zinc for up to 3 hours before initiating the 18O exchange assay. The rates of the uncatalyzed reactions were subtracted and the slopes of each corrected phase 2 are plotted against time. Data are representative of three independent experiments.
