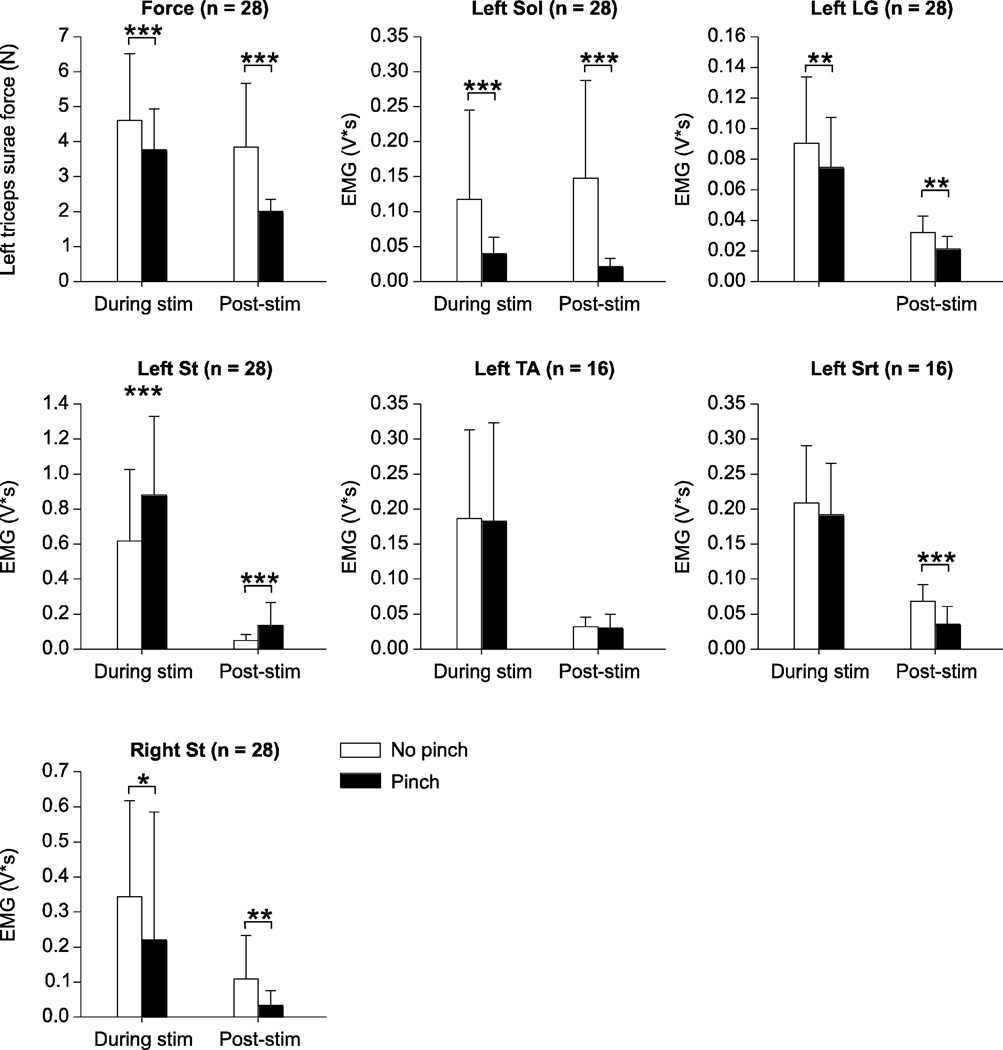
Figure 8. Pooled data showing the effect of back pinch on left triceps surae muscle force and electromyography (EMG) responses evoked during and following a series of 10 pulses delivered to the left tibial (n = 20) or superficial peroneal (n = 8) nerves.
The EMG activities of the left soleus (Sol), lateral gastrocnemius (LG), semitendinosus (St), tibialis anterior (TA), left sartorius (Srt), and of the right St were measured as described in figure 1C and in the methods. The number of paired trials is indicated in brackets at the top for each graph. Asterisks indicate significant differences between trials without and with back pinch using the Wilcoxon signed-rank test for paired data at p ≤ 0.05. * p ≤ 0.05; ** p ≤ 0.01; *** p ≤ 0.001.

