
FIGURE 3. Malaria infected TLR9−/− and MyD88−/− mice differentially produce cytokines.
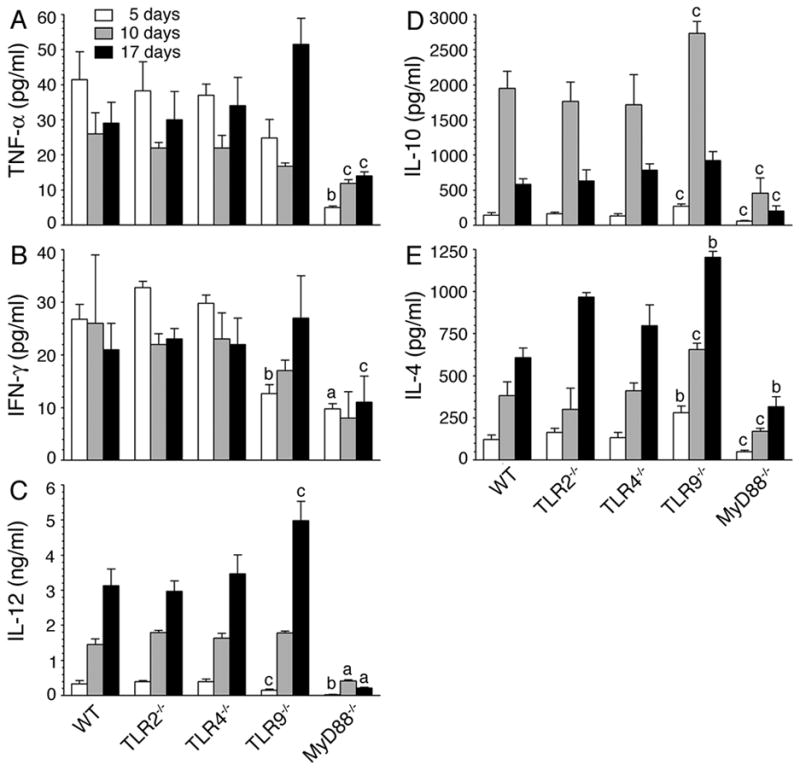
WT, TLR2−/−, TLR4−/−, TLR9−/− and MyD88−/− mice (n = 5 in each group) were infected with P. yoelii. Blood from the infected mice at 5, 10, and 17 days postinfection was collected, and sera prepared. TNF-α (A), IFN-γ (B), IL-12 (C), IL-10 (D) and IL-4 (E) present in the pooled sera were measured by ELISA. Experiments were performed two times and each time ELISA was performed in duplicates. The letters, a, b and c, represent the statistical significance between the levels of cytokines produced by the indicated gene knockout mice and those produced by the corresponding infected WT mice. a, p <0.001; b, p <0.01; c, p <0.05.