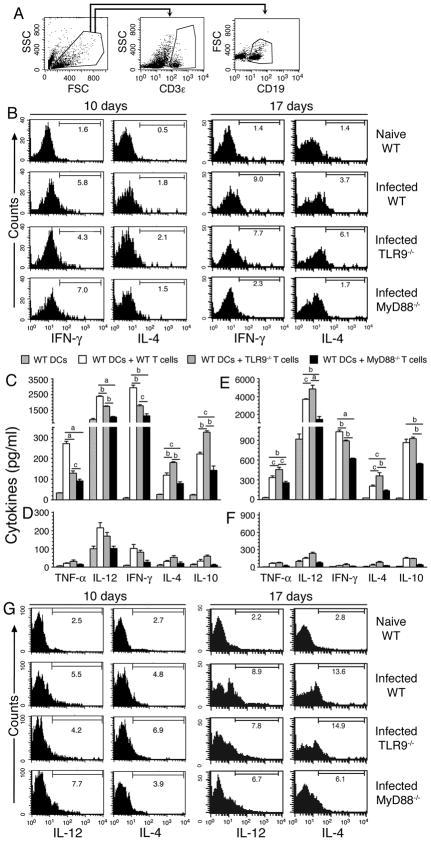
FIGURE 4. TLR9 and MyD88 are critical for production of cytokines by T and B cells.
Total spleen cells from WT, TLR9−/− and MyD88−/− mice at 10 and 17 days post infection were cultured for 4 h in the presence of GolgiPlug, surface stained with anti-mouse CD3ε antibody followed by intracellular staining using anti-cytokine antibodies, and analyzed by flow cytometry. (A) Cells were selected by side scattering (SSC) and forward scattering (FSC) and were gated for total T cells (CD3ε+; B) and B cells (CD19+; G). (B) Percent positive cells for each cytokine in gated T cells are shown in the histograms. Cells from naïve WT mice were analyzed as controls. Isolated spleen T cells from WT, TLR9−/− and MyD88−/− mice at 10 days (C and D) and 17 days (E and F) after infection were cocultured with WT FL-DCs in the presence or absence of P. yoelii IRBCs (C–F; D and F are controls for C and E, respectively). In parallel, WT FL-DCs alone was also stimulated with IRBCs as controls for cocultures. After 72 h, cytokines secreted into the culture medium were analyzed by ELISA. The letters, a, b and c represent statistical significance between the levels of cytokines in indicated groups of infected mice. a, p <0.001; b, p <0.01; c, p <0.05. (G) The cultured total spleen cells were surface stained for B cells using anti-mouse CD19 antibody followed by intracellular staining using antibodies against mouse IL-12 and IL-4. Histograms show the percent B cells positive for each cytokine. B cells from naïve WT mice were similarly stained and analyzed as controls.

