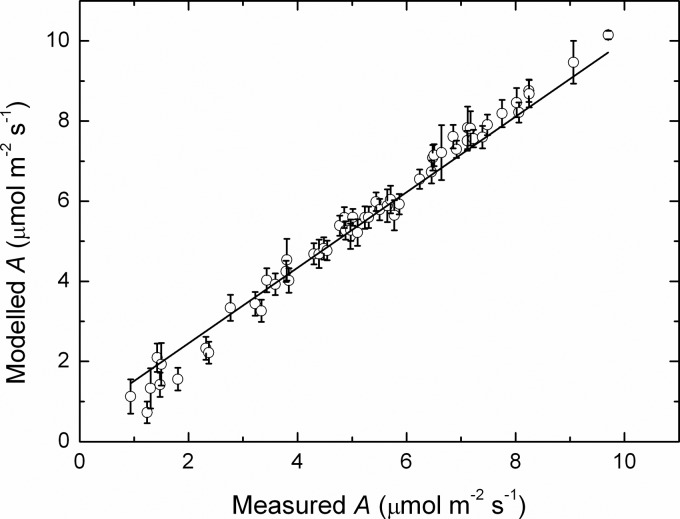
Fig. 6.
Modelled rates of photosynthesis as a function of the measured rates. Rates were averaged over each vine and replicate (mean ± SE, N = 9) of Semillon vines growing in an irrigated vineyard during the 2009/10 growing season. The line is a linear regression fitted to the whole dataset (slope 1.104 ± 0.008 mol mol−1, r2 = 0.82, P < 0.0001).

