
Figure 3.
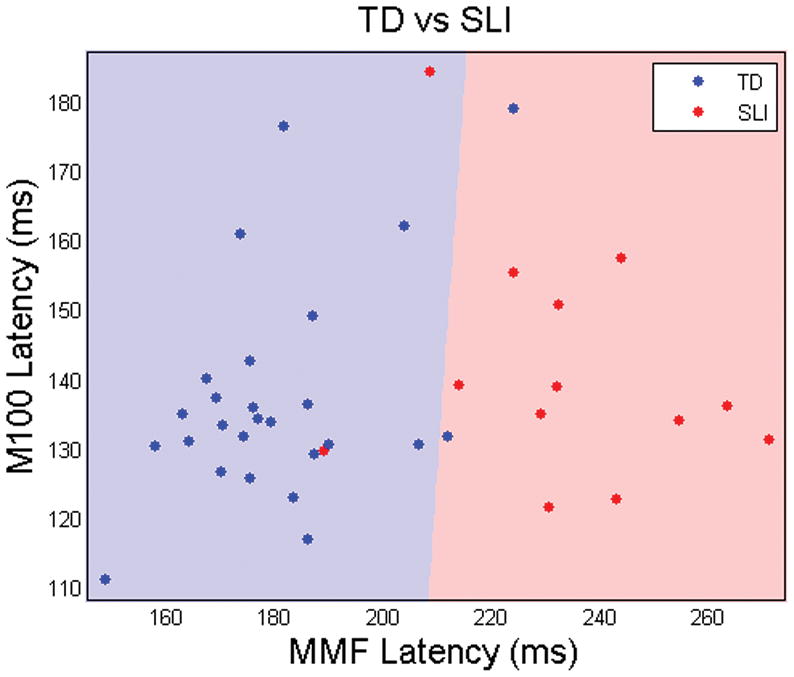
Age-corrected M100 and mismatch field peak latencies (blue dots=TD controls, red=SLI). Zones are shaded blue or red according to the response to that gridpoint from the 5-fold cross-validated linear discriminant function trained on the control and specific language impairment groups. The near vertical nature of the red/blue border reflects the major role of mismatch field peak latency and the minor role of M100 peak latency in predicting group membership.