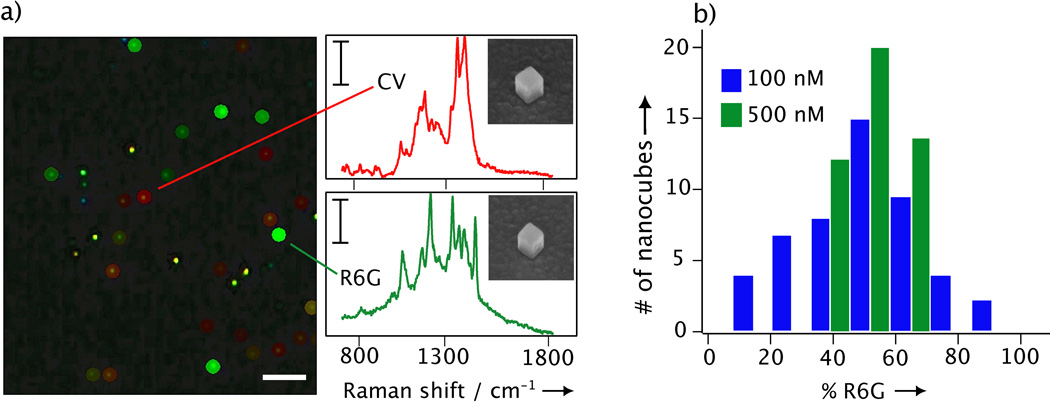
Figure 5.
a) Dark-field optical micrograph of Ag nanocubes on a Ag film, with a SERS color map overlay to mark the SERS spectra uniquely from CV (red) or R6G (green). The other colors indicate that the spectra were a combination of both dyes. The scale bars are 10 µm and 8 adu mW−1 s−1, respectively, for the dark-field image and SERS spectra. The inset show SEM images (at a tilt angle of 45°) of the nanocubes from which the two spectra were recorded. b) Histogram of the percentage the SERS spectrum from a nanocube was characterized as R6G (PR6G) at concentrations of 100 nM and 500 nM. The SERS spectra were acquired with 514 nm excitation, 1 s acquisition, and 0.5 mW laser power.

