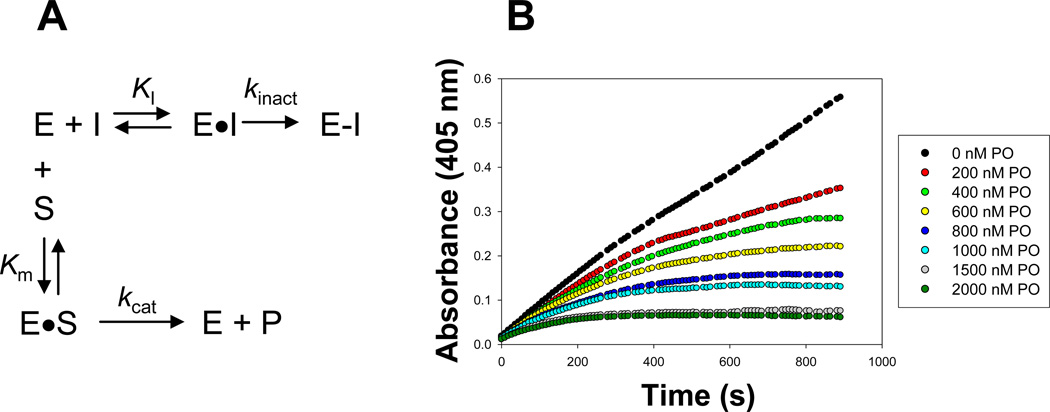
Figure 1. Effect of substrate on the progressive inhibition of a serine hydrolase by oxon.
(A) Kinetic scheme describing the inhibition of serine hydrolases (E) by oxons (I) in the presence of an ester substrate (S). The turnover number kcat for the ester substrate (S) is a function of the rates of acylation (k2) and deacylation (k3) [i.e., kcat = k2*k3/(k2+ k3)] (Streit et al., 2008); however, these steps are not explicitly shown for simplicity. (B) Inhibition of CES2 hydrolytic activity by varying concentrations of paraoxon. The progress of the pNPV hydrolysis reaction was followed by measuring the absorbance of liberated p-nitrophenol at 405 nm every 9 s for 15 minutes.

