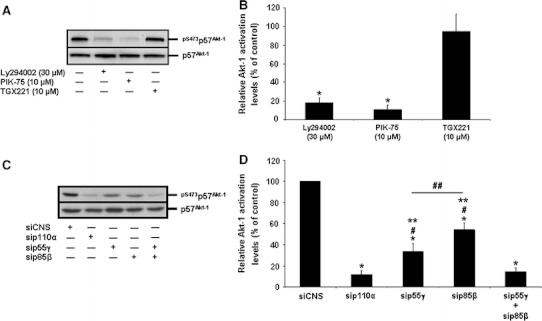
Fig. 3.

Distinct roles of PI3-K isoforms in the activation of Akt-1 in HIEC cells. a Representative (n ≥ 4) WB analyses of Akt-1 IP from untreated HIEC cell cultures (control) and from cultures treated with Ly292002, PIK-75 or TGX221. Specific antibodies for pS473p57Akt-1 and p57Akt-1 were used. b Same as in (a), except that the relative activation levels of Akt-1 were established, then compared to controls. Statistically significant (0.0001 ≤ P ≤ 0.001) differences between treated and control cultures are indicated by (*). c Representative (n ≥ 3) WB analyses of Akt-1 IP from HIEC cells transfected with siCNS (control), sip110α, sip55γ, sip85β, or a combination of sip55γ + sip85β. Specific antibodies for pS473p57Akt-1 and p57Akt-1 were used. d Same as in (c), except that the relative activation levels of Akt-1 were established, then compared to controls. Statistically significant (0.0001 ≤ P ≤ 0.001) differences between treated and control cultures are indicated by (*); statistically significant (0.0005 ≤ P ≤ 0.005) differences with sip110α are indicated by (#); statistically significant (0.0005 ≤ P ≤ 0.005) differences with the combination sip55γ + sip85β are indicated by (**); statistically significant (0.001 ≤ P ≤ 0.01) differences between sip55γ and sip85β are indicated by (##)
