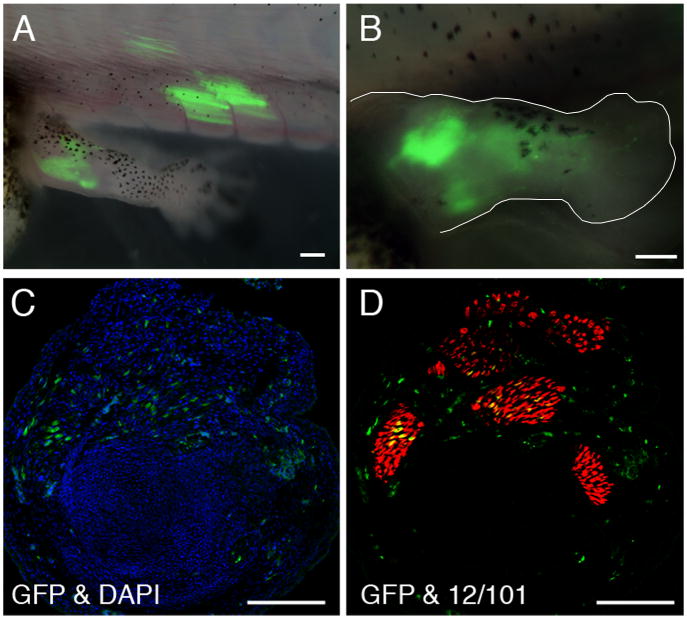
Figure 6. Adeno-GFP infection of Xenopus tadpoles at stage 54-56.
A. GFP fluorescence visible in muscle and limb five days after injection (muscle and limb injected separately).
B. Higher power of another specimen showing GFP in a limb (outlined).
C. Distribution of GFP-expressing cells in the limb shown in B by anti-GFP antibody (green) and DAPI (blue) staining.
D. Tissue distribution of positive cells shown by staining with anti-GFP antibody (green) and 12/101 (anti-muscle antibody, red). Some GFP positive cells are muscle fibers and others are connective tissue cells.
Scale bars: 500 μm.

