Figure 1.
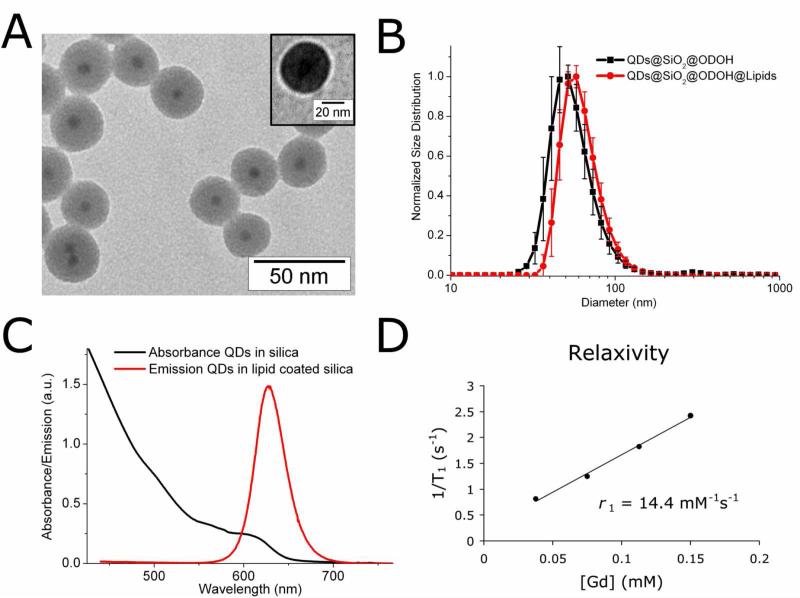
(A) TEM image of monodisperse QD/silica particles of 31 nm (± 4 nm) with a single QD (7.7 nm, black spots) incorporated in the centre. Inset shows an image from negative staining TEM, where the bright corona illustrates the hydrophobic layer around the silica particle. (B) DLS of ODOH capped QD/silica nanoparticles and ODOH capped QD/silica nanoparticles encapsulated in lipids. (C) Absorption and emission spectra of the CSS-QDs in silica. (D) Relaxation rates of the Q-SiPaLCs as a function of the concentration of Gd3+ ions (determined by ICP-MS).

