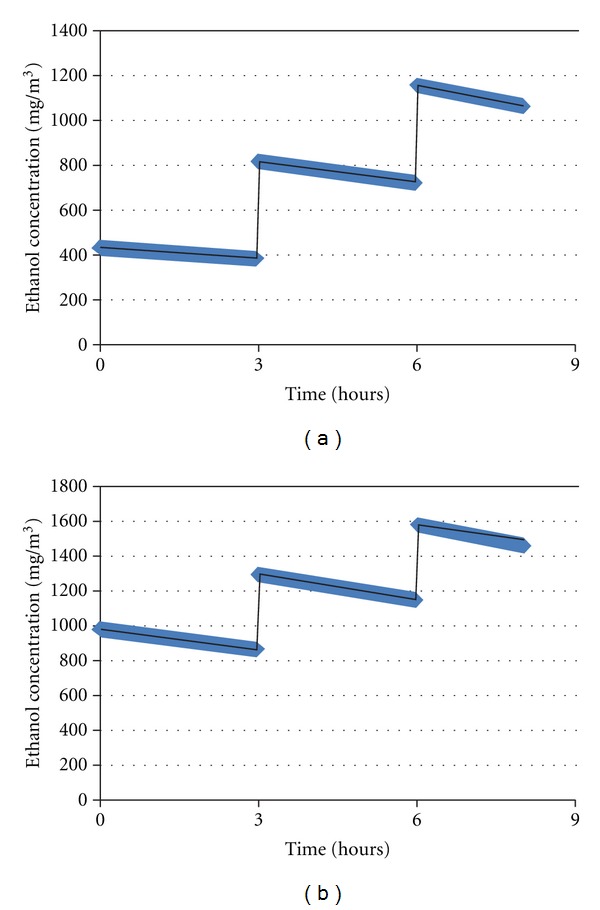
Figure 2.

(a) Atmospheric ethanol concentration (day 1). By using the AIHA software, the ethanol atmospheric emission was calculated as follows: 30 rubbing hands (RH) at time 0 h, 30 RH at 3 h and 30 RH at 6 h resulting in a mean ethanol atmospheric concentration of 408 mg/m3 (time 0–3 h), 768 mg/m3 (time 3–6 h), and 1108 mg/m3 (time 6–8 h). (b) Atmospheric ethanol concentration (day 2). By using the AIHA software, the ethanol atmospheric emission was calculated as follows: 30 rubbing hands (RH) at time 0 h, 30 RH at 3 h, and 30 RH at 6 h resulting in a mean ethanol atmospheric concentration of 924 mg/m3 (time 0–3 h), 1224 mg/m3 (time 3–6 h), and 1518 mg/m3 (time 6–8 h).
