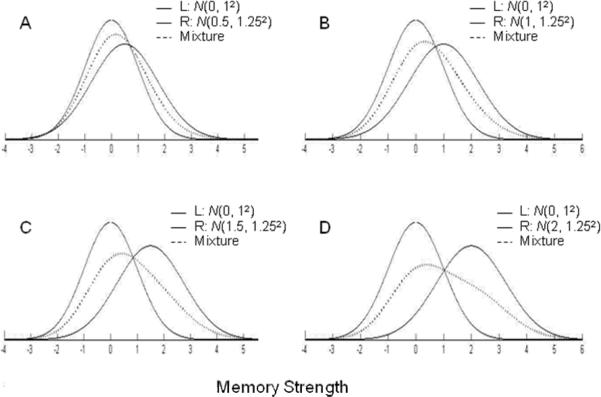
Figure 2.
Non-Gaussian mixture distributions produced by mixing two Gaussian distributions, where the means of the left (L) and right (R) distributions differ by 0.5 (A), 1.0 (B), 1.5 (C) and 2.0 (D) standard deviations (the standard deviation of the left distribution is 1.0; and the standard deviation of the right distribution is 1.25 in each case). For each panel, the Gaussian distributions are shown as solid lines, and the resulting mixture distribution is shown as a dotted line. Note that the mixture distributions are all non-Gaussian even though the mixture distribution in Panel A appears to be Gaussian in form.

